FastCCC’s Outputs
Introduction
All files (except *_significant_results.tsv) follow the same structure: rows represent interacting cell type pairs while columns depict interacting ligand-receptor pairs.
- The
*_significant_results.tsvfile contains ligand-receptor pairs with a p-value < 0.05 in sender-receiver cell type interactions. - The
*_pvals.tsvfile provides p-values for each ligand-receptor interaction (columns) across different cell-cell interaction pairs (rows). - The
*_interactions_strength.tsvfile includes interaction strengths (i.e., communication scores) for each ligand-receptor interaction (columns) across cell-cell interaction pairs (rows). - The
*_percents_analysis.tsvfile indicates whether the proportion of cells expressing both the ligand and receptor (nonzero expression) exceeds a given threshold.
Outputs of statistical_analysis_method
The statistical_analysis_method function returns three variables, representing the communication score, p-values, and percent analysis for each ligand-receptor interaction (columns) across different cell-cell interaction pairs (rows) in a pandas.DataFrame format. These three DataFrames are also saved to a specified directory, with filenames structured as shown in the figure.
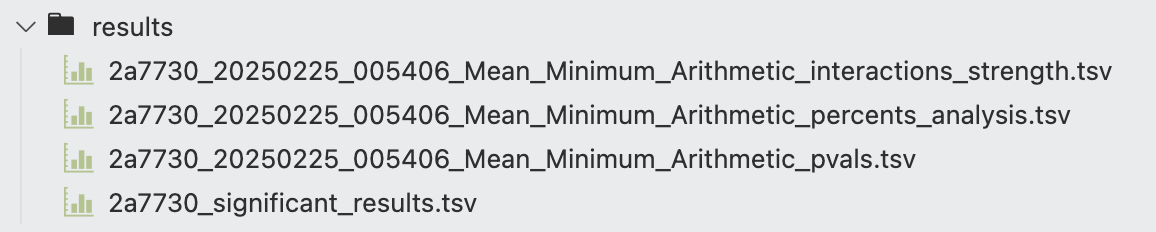
Each filename begins with a unique task ID (e.g., 2a7730 in the figure), assigned when running FastCCC to distinguish results from different tasks. This is followed by a timestamp (e.g., 20250225_005406), indicating the time when the computation was completed. The next part of the filename specifies the method used to compute the communication score. In the example shown, the results for task 2a7730 were obtained using the Mean statistic as the single-unit summary function, the Minimum function to aggregate complex units, and the arithmetic mean to combine ligand and receptor scores for the final communication score.
The subsequent part of the filename describes the content of the saved file, as introduced in the Introduction section. The _significant_results.tsv file is derived from the _pvals.tsv file, containing ligand-receptor interactions with \(p\)-values < 0.05 across different cell-cell interaction pairs.
Example of the _significant_results.tsv file format
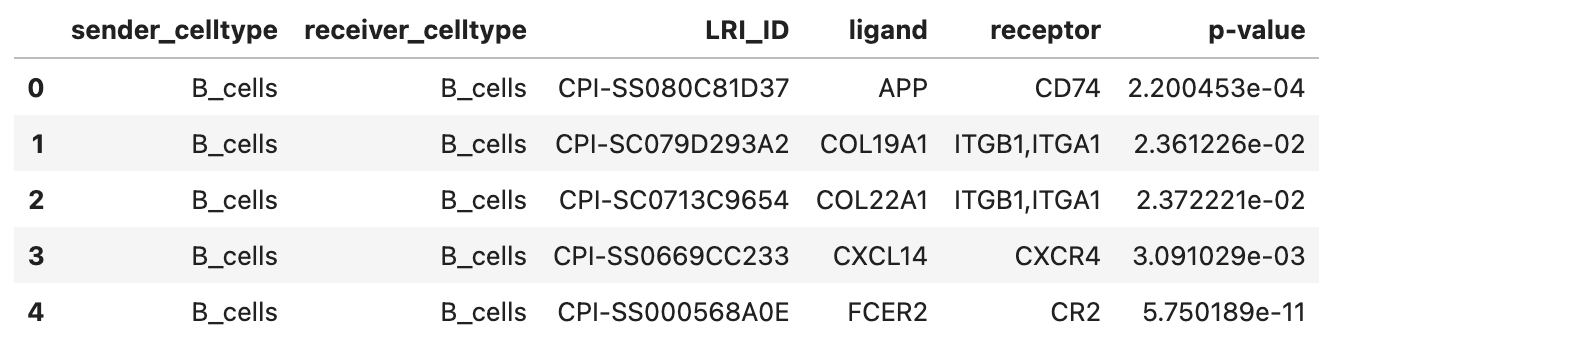
As indicated by the column names, from left to right, the file contains the sender cell type, receiver cell type, ligand-receptor interaction ID, ligand, receptor, and the corresponding p-value.
Example of the _pvals.tsv file format
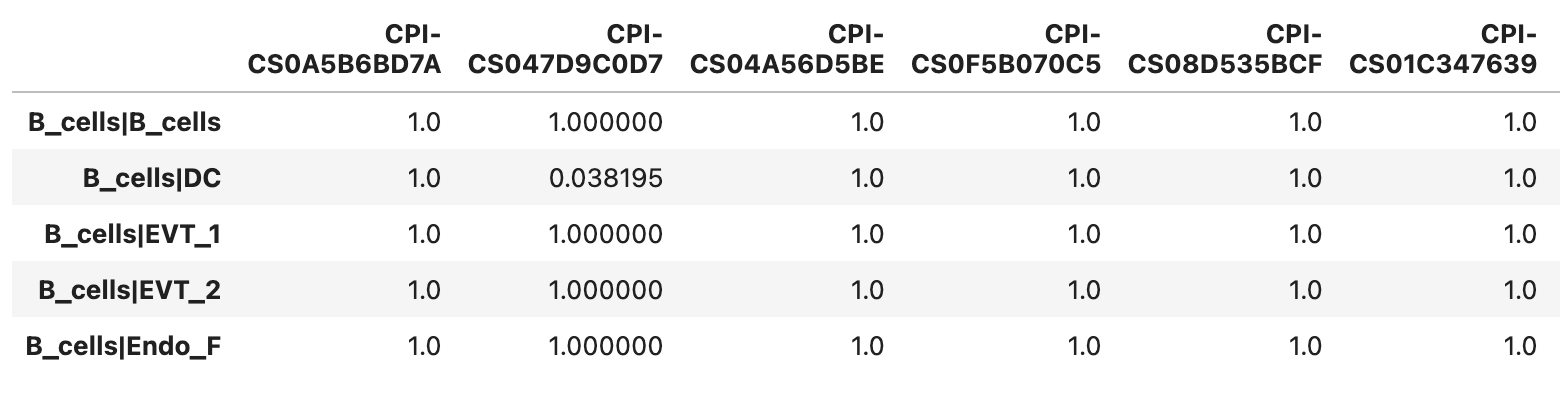
A \(p\)-value of 1.0 indicates that the candidate ligand-receptor interaction (LRI) does not meet the filtering criteria (e.g., the proportion of nonzero expression is below the specified threshold, or the involved ligand or receptor is not differentially expressed in the corresponding cell type when use_DEG=True is set). Alternatively, it may be the direct result computed by FastCCC. In general, \(p\)-values \(\ge 0.05\) are considered nonsignificant.
Example of the _interactions_strength.tsv file format
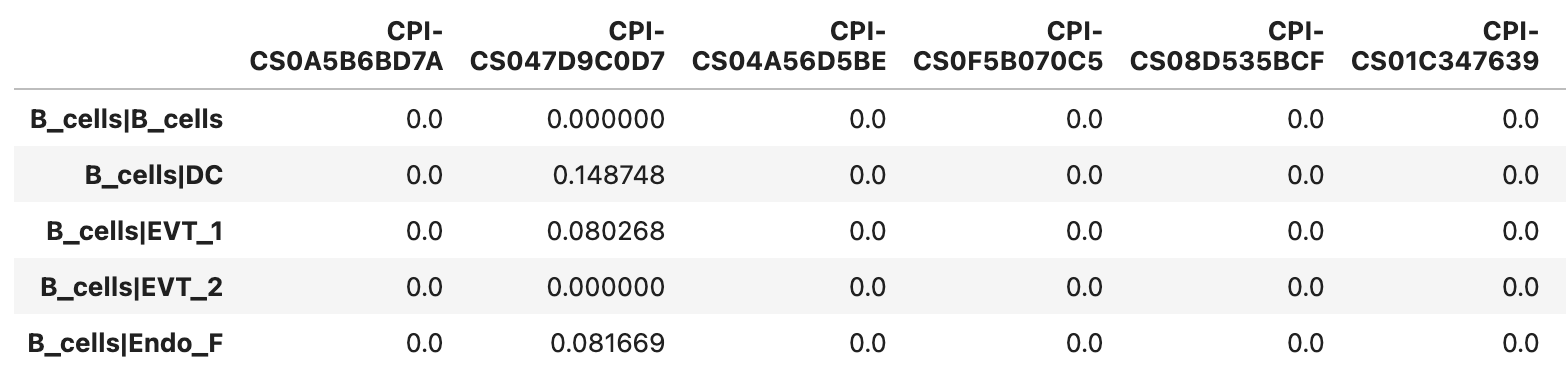
Each value represents the communication score.
Example of the _percents_analysis.tsv file format
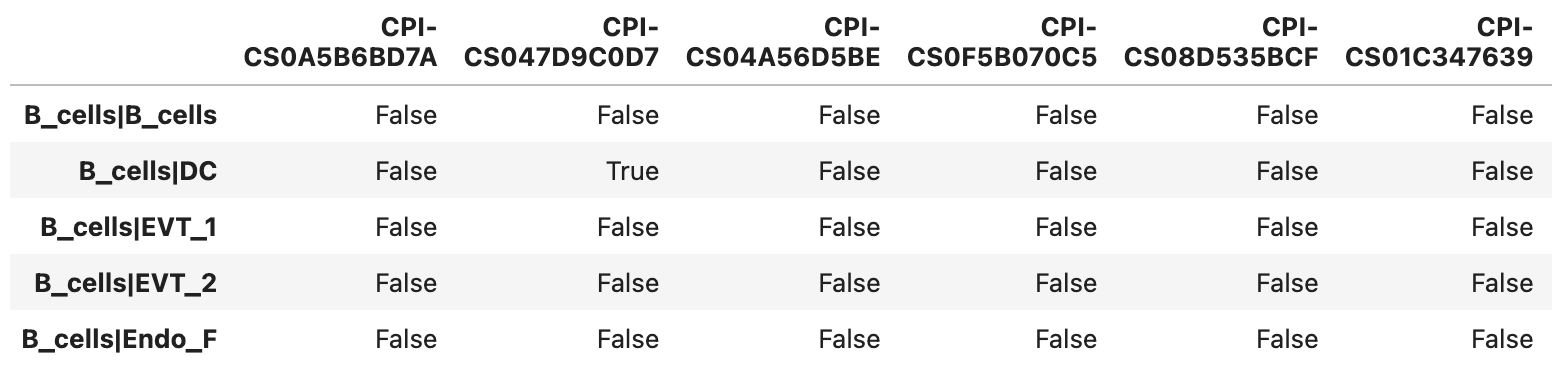
True indicates that the proportion of nonzero expression for both the ligand and receptor exceeds the specified threshold.
Outputs of Cauchy_combination_of_statistical_analysis_methods
The results of Cauchy_combination_of_statistical_analysis_methods are largely consistent with those described earlier. Each distinct computational combination generates _pvals.tsv, _interactions_strength.tsv, and _percents_analysis.tsv files, named according to the specific combination of methods used in that branch.
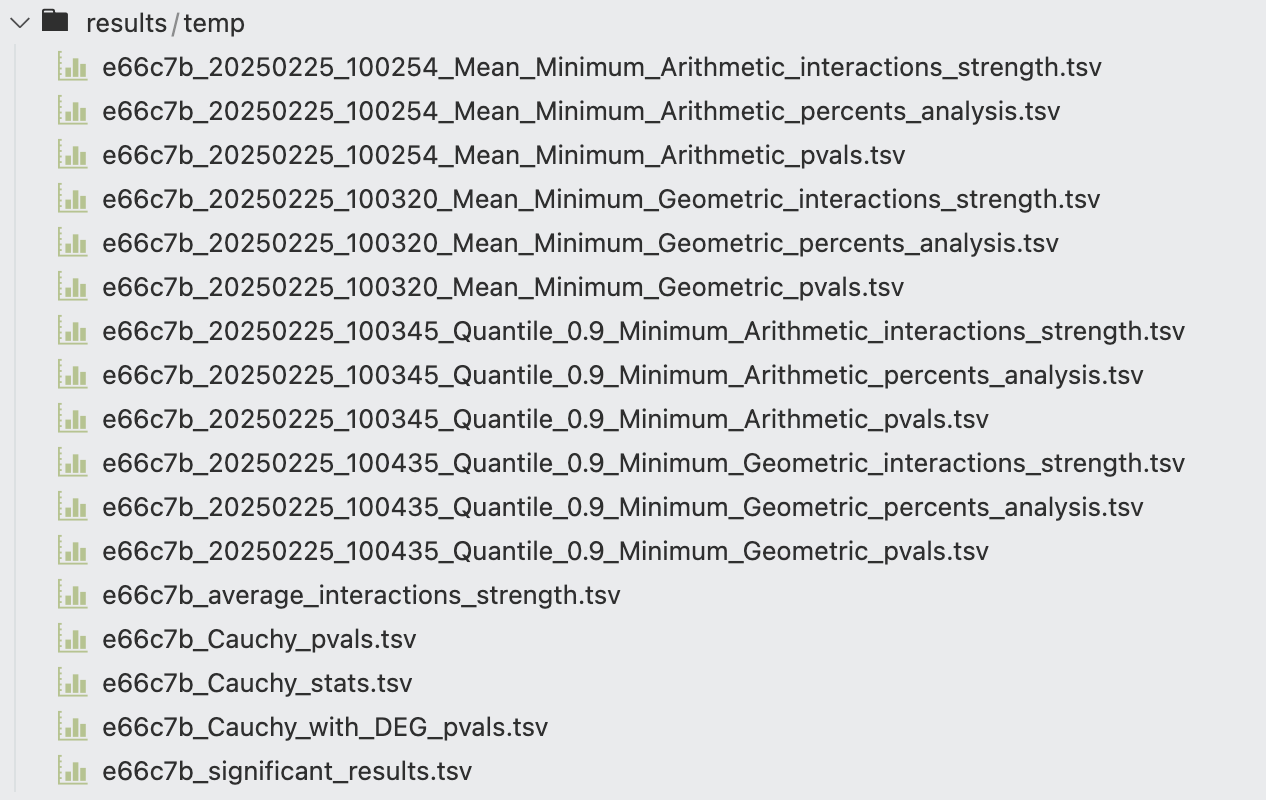
Additionally, FastCCC integrates the \(p\)-value results from all combinations and calculates the Cauchy combination statistics and corresponding p-values, which are stored in _Cauchy_stats.tsv and _Cauchy_pvals.tsv, respectively. The average communication scores across all combinations are saved in _average_interactions_strength.tsv. If the use_DEG=True parameter is enabled, an additional file, _Cauchy_with_DEG_pvals.tsv, is generated, where the \(p\)-values of ligand-receptor interactions (LRIs) with non-differentially expressed ligands or receptors in the corresponding cell types are set to 1.0, indicating non-significance. Finally, all significant LRIs are extracted and saved to _significant_results.tsv.
The specific file formats and contents have been detailed earlier. You can refer to the previous section here.